I had posted measurements (frequency response graphs) earlier for final A4000 based on my old rig. Here are the latest measurements based on v1.0 of my IEM Measurement Rig.
final A4000 Left and Right Channel Frequency Responses
3 samples each of the left and right channel. For each sample I remove and re-insert the IEM.

final A4000 Average Frequency Response
Average of 6 samples (3 samples of left channel plus 3 samples of right channel).

final A4000 vs Etymotic ER2XR (normalized at 85dB@1kHz)

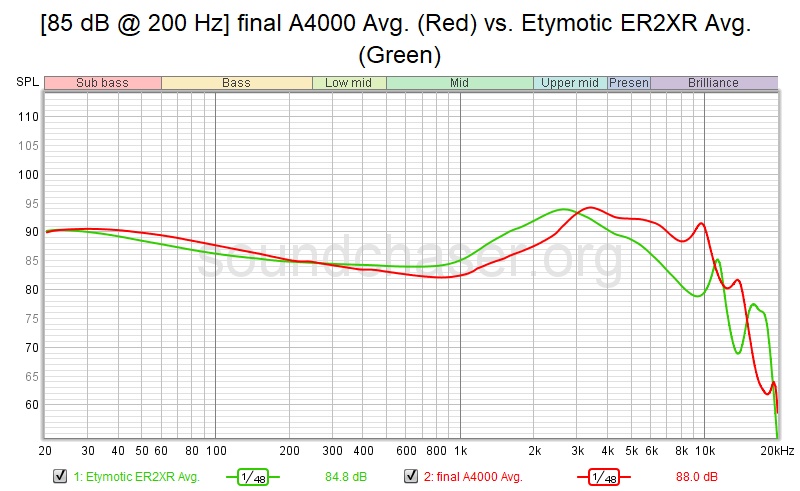
final A4000 vs Etymotic ER2XR (normalized at 85dB@200Hz)
One thought on “final A4000 Measurements (Frequency Response Graphs) and Comparisons with Etymotic ER2XR”